

Every December, a curious optimism settles over Wall Street. Traders whisper about Santa Claus - not the one who slides down chimneys, but the one who supposedly lifts stock prices in the final days of the year. It’s become one of the market’s most enduring pieces of folklore, referenced in countless year-end articles and trading desk conversations.
But as we sit here on December 26, 2025, right in the middle of what should be this year’s rally, a simple question demands a rigorous answer: Is any of this actually real?
To find out, we analyzed 22 years of daily market data across four major indices - over 22,000 individual trading days. What we discovered challenges some assumptions, confirms others, and offers a sobering perspective on what this year’s struggling rally might mean for 2026.
The Legend and the Data
The Santa Claus Rally was first documented in 1972 by Yale Hirsch, founder of the Stock Trader’s Almanac. Hirsch noticed that the stock market displayed a peculiar tendency to rise during a specific seven-day window: the last five trading days of December and the first two trading days of January. He immortalized this observation with a warning that has echoed through trading floors for half a century:
“If Santa Claus should fail to call, bears may come to Broad and Wall.”
The reference to Broad and Wall - the intersection where the New York Stock Exchange stands - wasn’t merely poetic. Hirsch meant it as a genuine caution: when the rally fails, trouble often follows.
But folklore requires scrutiny. We pulled daily price data for the S&P 500 (SPY), Nasdaq 100 (QQQ), Russell 2000 (IWM), and Dow Jones (DIA) spanning from 2003 to 2025. The results are unambiguous: the Santa Claus Rally is not a myth. Over our 22-year dataset, the S&P 500 posted positive returns during this seven-day window 72.7% of the time, delivering an average gain of 0.59%. To appreciate what this means, consider that a typical seven-day period in the market averages just 0.2% with a 57% win rate. The Santa Rally delivers nearly three times the return with significantly higher reliability.
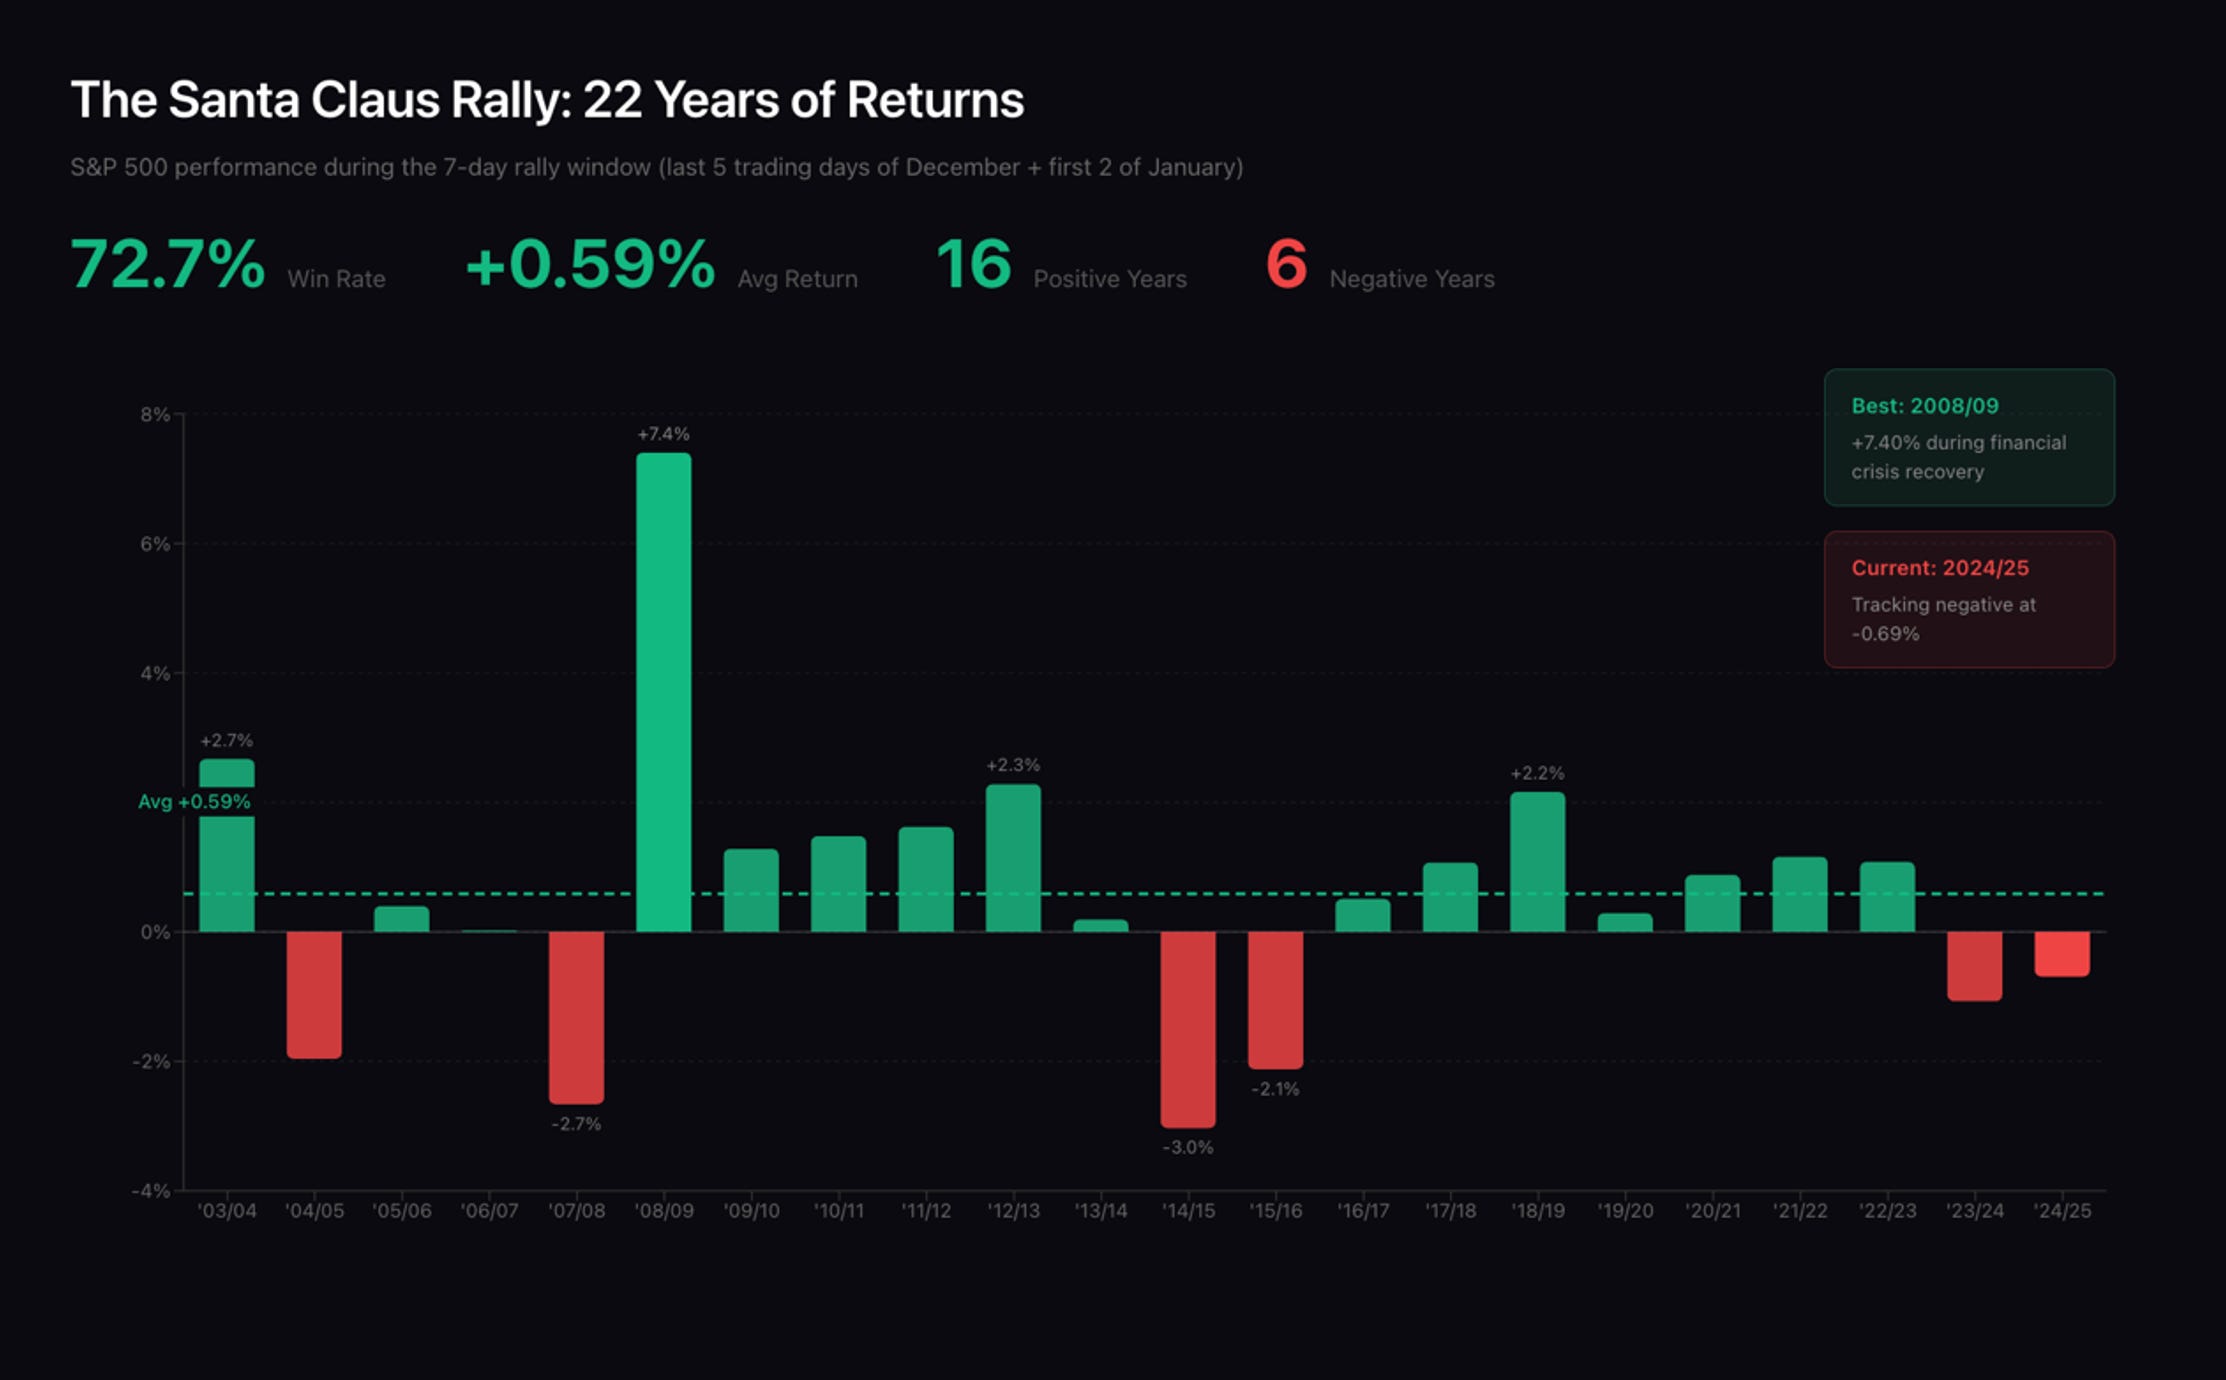
The pattern holds across different market environments. The rally succeeded during the bull markets of 2017 and 2019, during the recovery from the 2008 financial crisis (which produced the strongest rally in our dataset at +7.4%), and during the volatile post-pandemic years. When it fails, the losses are typically modest, the worst year in our data, 2014/2015, saw a decline of just 3%. The asymmetry is notable: the upside has historically outweighed the downside.
Yet not all indices participate equally in the holiday cheer. While the S&P 500 leads with its 72.7% win rate, the tech-heavy Nasdaq succeeds only 60% of the time with smaller average gains of 0.31%. Small-cap stocks, represented by the Russell 2000, fare even worse at 59.1%. This divergence suggests the rally is primarily a large-cap phenomenon, perhaps because the institutional dynamics that drive it (which we’ll explore shortly) affect blue-chip stocks more directly.
Why Santa Shows Up
Understanding why the rally occurs requires examining the unique market dynamics of late December. The most compelling explanation centers on tax-loss harvesting - the practice of selling losing positions before year-end to offset capital gains. This selling pressure, which peaks in early-to-mid December, artificially depresses stock prices. Once the December 31 deadline passes and this forced selling subsides, stocks naturally rebound as investors redeploy their capital.
Equally important is who’s actually trading during the holidays. Many institutional investors - hedge fund managers, pension fund traders, and other sophisticated market participants - take the week between Christmas and New Year’s off. This leaves the market disproportionately influenced by retail investors, who research consistently shows are more bullish and less likely to short stocks. With fewer skeptics actively trading, the path of least resistance tilts upward.
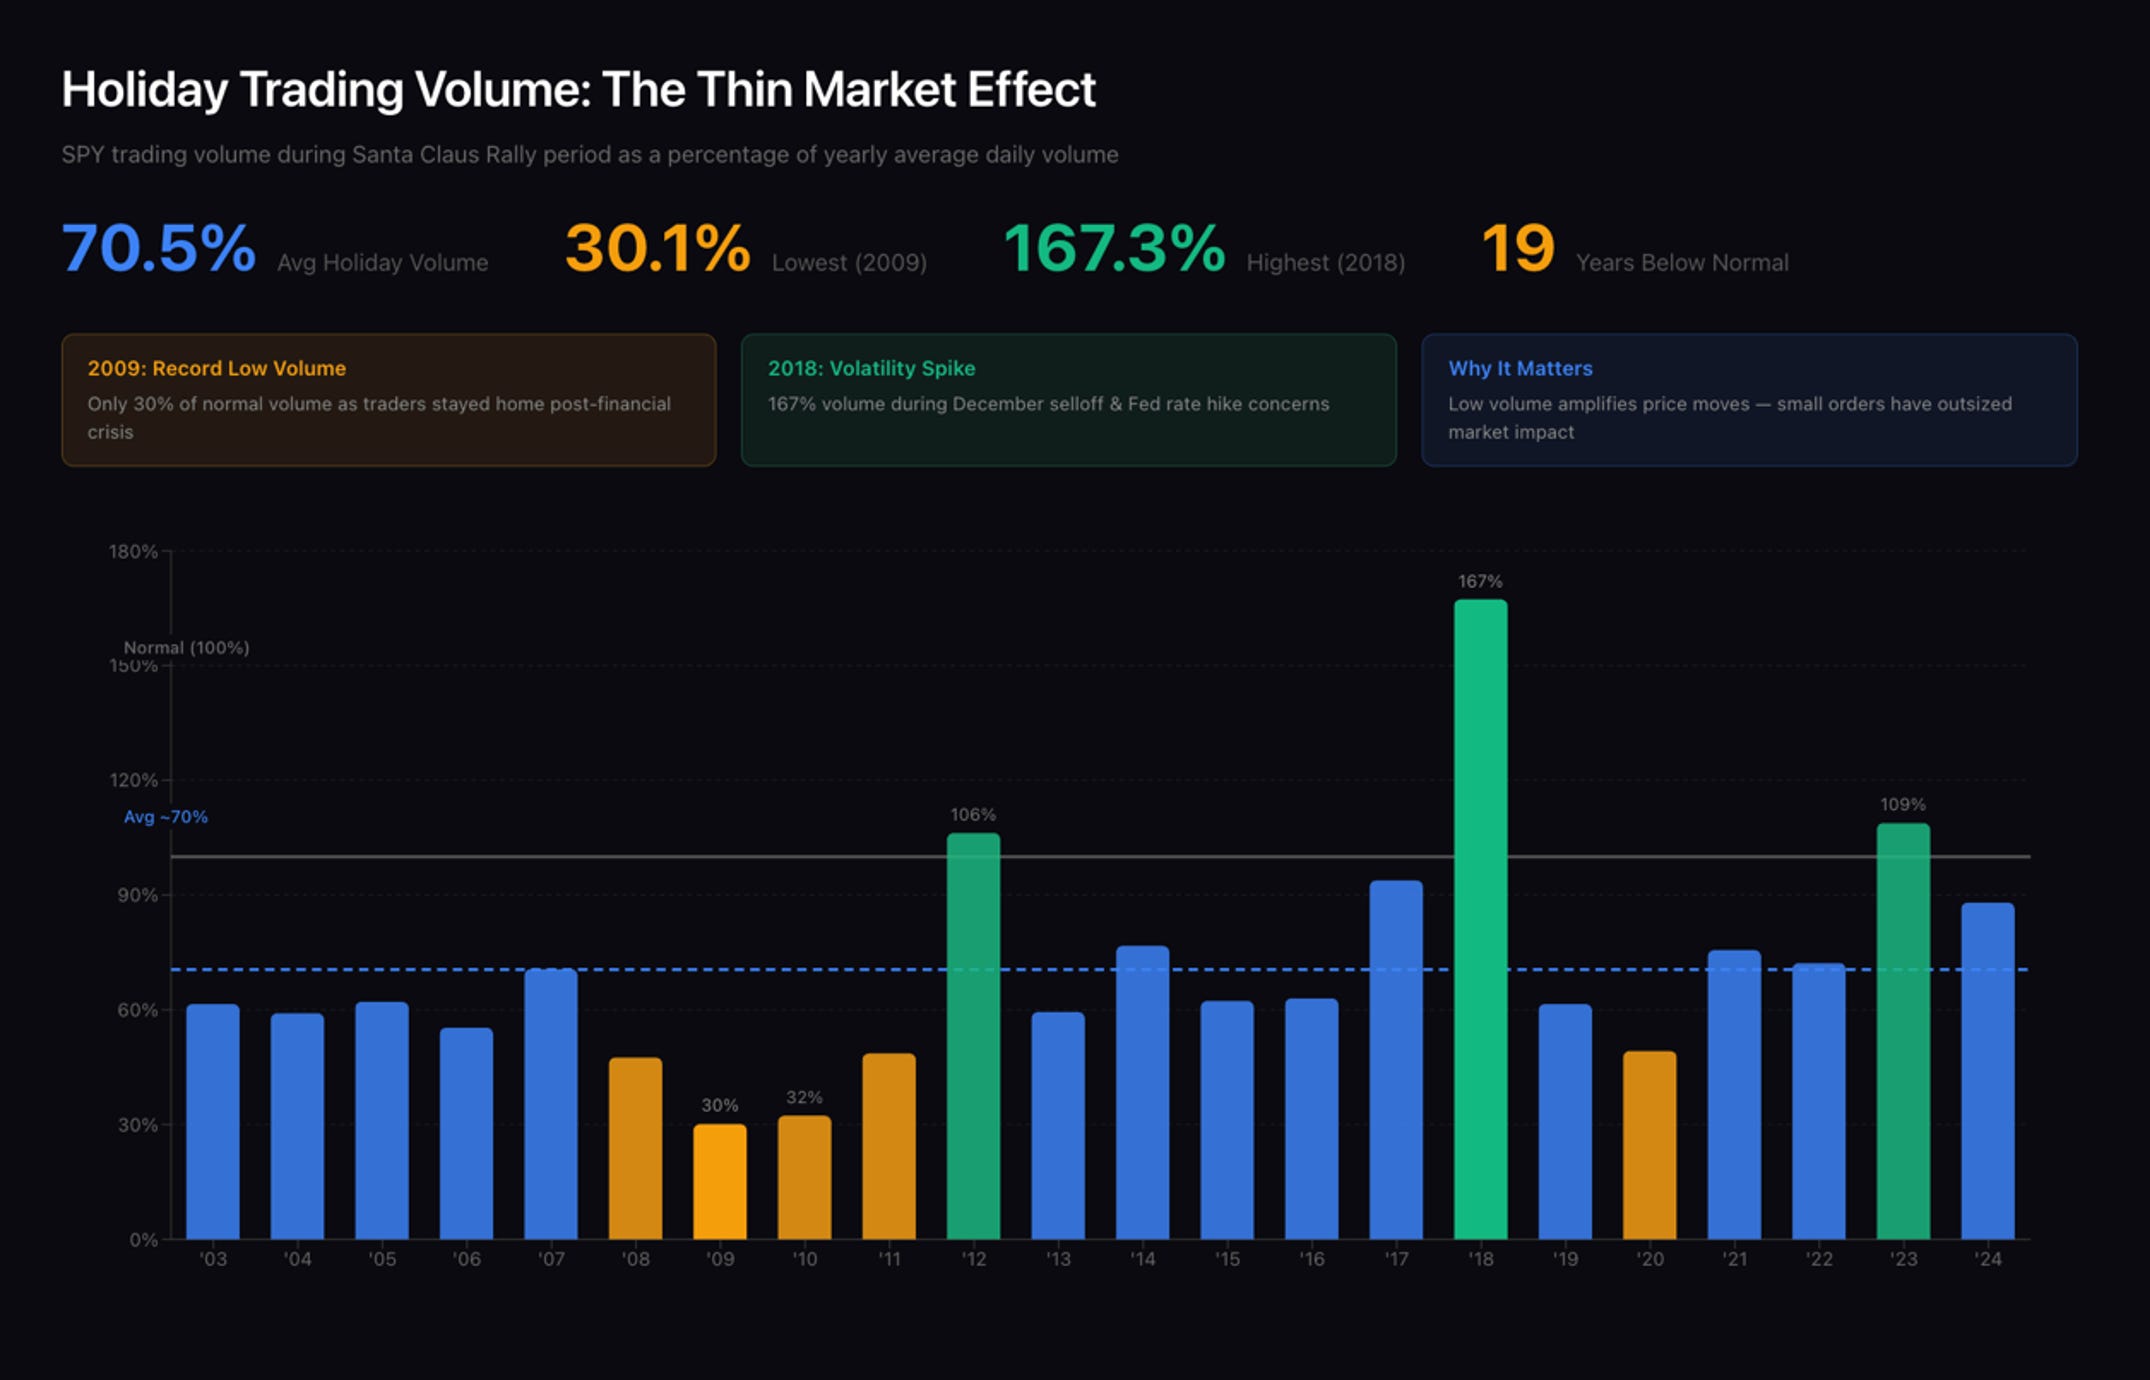
Our volume analysis confirms this dynamic. Holiday trading volume drops to approximately 70% of normal levels on average, with some years seeing even more dramatic declines - 2009’s holiday period saw volume plunge to just 30% of typical trading. In these thin markets, even modest buying pressure can move prices meaningfully. A few million dollars of year-end bonus money flowing into index funds has outsized impact when there’s no institutional selling to absorb it.
There’s also the phenomenon of window dressing. Fund managers, knowing their year-end portfolios will be published in annual reports, often buy strong performers in December to make their holdings look more impressive. This last-minute buying of winning stocks creates additional upward pressure on the very indices that comprise the Santa Claus Rally. Add in the general optimism that accompanies the holiday season - and the notable absence of potentially market-moving events like earnings releases or Fed meetings - and conditions are ripe for stocks to drift higher.
A Related Myth Worth Debunking
While investigating the Santa Claus Rally, we tested another celebrated market anomaly: the January Effect. First documented by investment banker Sidney Wachtel in 1942, this theory holds that small-cap stocks dramatically outperform large caps in January, as beaten-down stocks rebound from year-end tax-loss selling. For decades, academic research confirmed the pattern was so reliable it posed a genuine puzzle for efficient market theorists.
Those days are over. In our 22-year dataset, the Russell 2000 outperformed the S&P 500 in January only 36.4% of the time - worse than a coin flip. On average, large caps actually beat small caps in January by 0.38 percentage points. The January Effect hasn’t just weakened; in modern markets, it has effectively reversed.
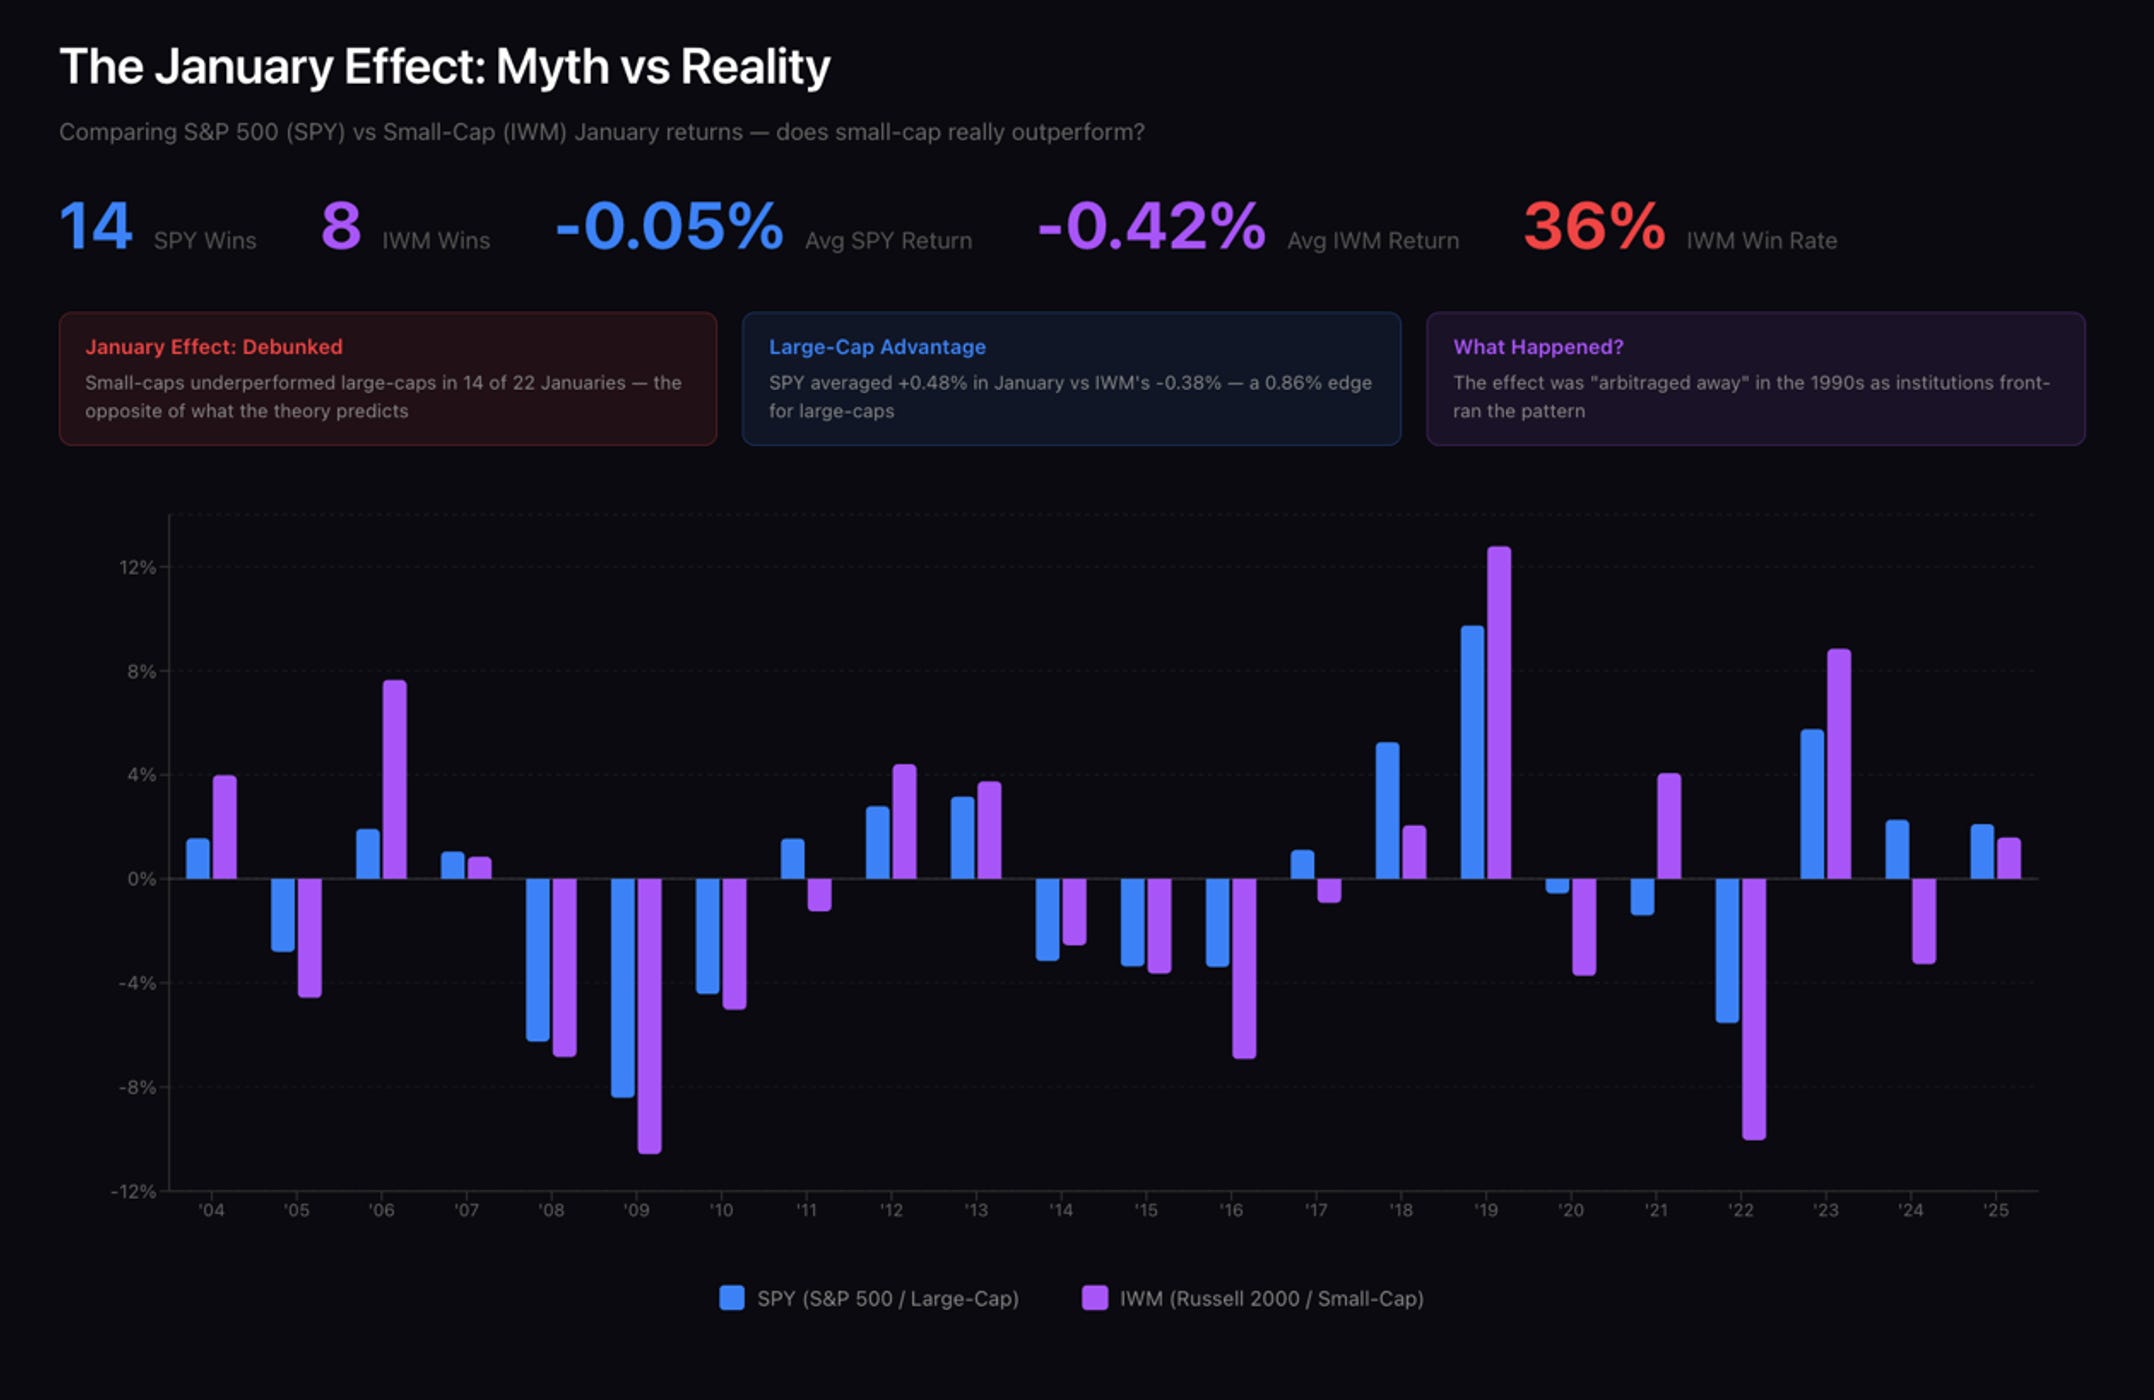
What killed the January Effect? Ironically, its own success. Once the pattern became widely known in academic and professional circles, institutional traders began front-running it - buying beaten-down small caps in late December rather than waiting for January. The arbitrage opportunity evaporated as everyone rushed to exploit it simultaneously. The proliferation of tax-advantaged retirement accounts (401(k)s, IRAs) further reduced the prevalence of tax-loss harvesting that created the opportunity in the first place. The January Effect serves as a cautionary tale: market anomalies, once publicized, often self-destruct.
What This Year Tells Us About Next
As of December 24, 2025, this year’s Santa Claus Rally is tracking slightly negative. This continues a troubling pattern: last year’s rally also failed, with the S&P 500 selling off every single trading day between Christmas and New Year’s - a historic first for the index. Despite this, 2024 still delivered a 23.3% annual gain, demonstrating that a failed rally isn’t necessarily a death sentence.
Yet history suggests we should pay attention. Research from LPL Financial shows meaningful divergence in outcomes based on rally results. When Santa delivers a positive seven-day window, the S&P 500 has historically averaged a 1.4% gain in January and a 10.4% return for the full year. When the rally fails, those figures drop to -0.1% for January and just 6.1% for the subsequent year. The difference - over four percentage points in annual returns - is economically significant.
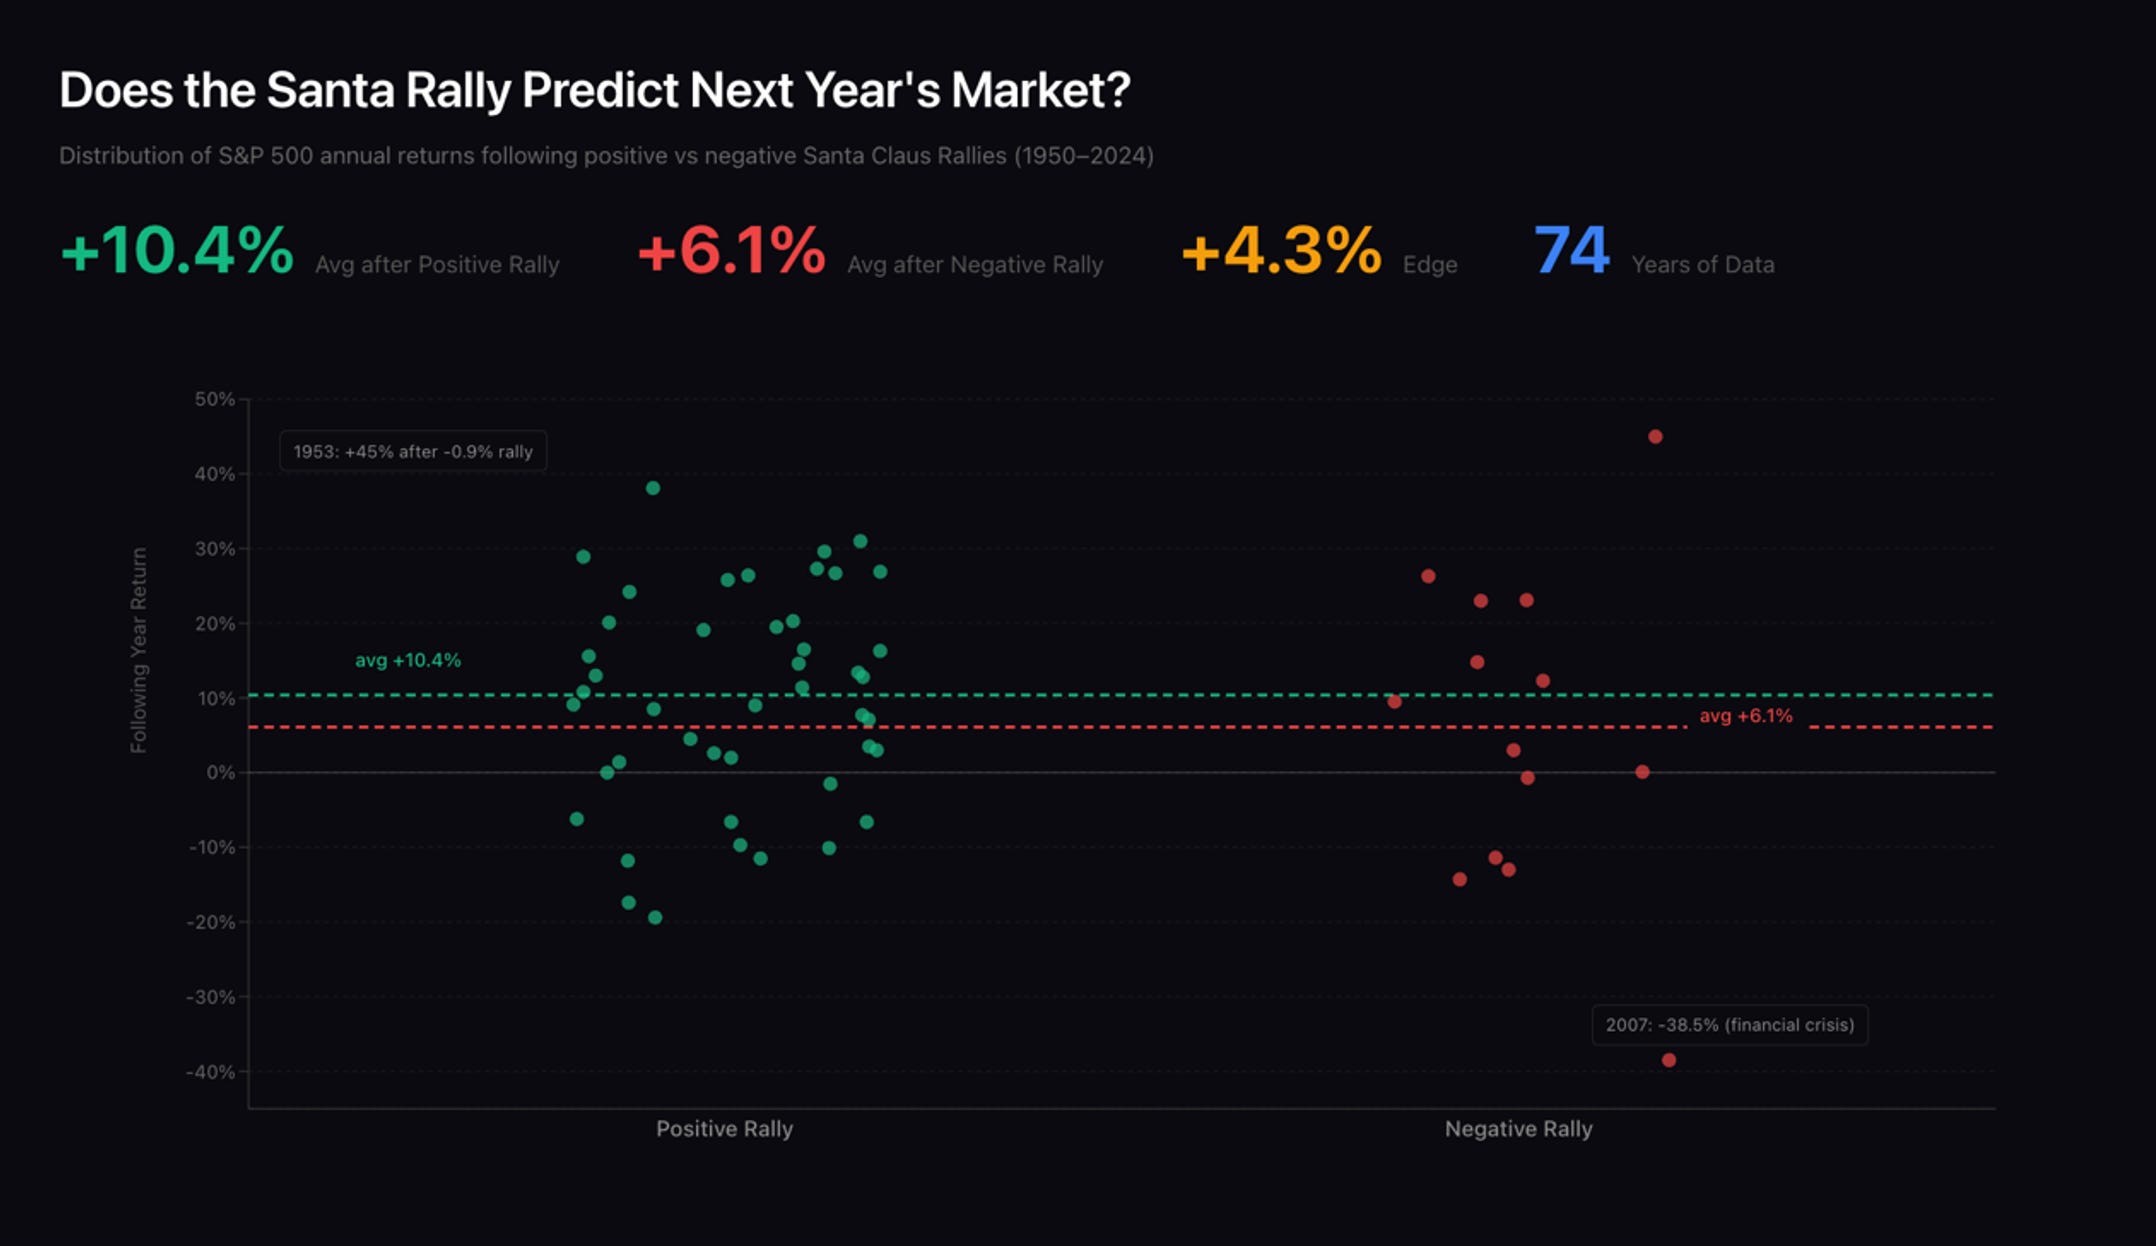
Perhaps most notable is the rarity of our current situation. Since 1950, there have never been three consecutive years of negative Santa Claus Rally returns. We’re now facing the possibility of exactly that. Whether this represents mean-reversion opportunity or a genuine shift in market dynamics is impossible to know in advance. But the setup is historically unusual, and unusual setups demand attention.
The rally window remains open through January 5, 2026 - five more trading days for Santa to potentially reverse course. The market has already shown signs of recovery, with the S&P 500 hitting new all-time highs on Christmas Eve. Whether this represents the beginning of a late rally or merely a temporary bounce before further weakness will determine which side of Yale Hirsch’s famous ledger 2025 lands on.
What should investors make of all this?
The Santa Claus Rally is real - statistically validated across decades of data. But its something that has occurred historically, not a guarantee. It tells us something about typical market behavior during a specific window, not what will happen in any given year. The January Effect, by contrast, has been arbitraged into irrelevance - a reminder that even the most robust anomalies can disappear once they become common knowledge.
For this year specifically, the failing rally warrants caution but not panic. Markets don’t follow calendars; they follow fundamentals, policy, and sentiment. The Fed’s rate path, AI-driven earnings expectations, and Treasury yields will matter far more for 2026 than whether stocks managed to eke out gains in the final week of December. Use the Santa Claus Rally as one data point among many - a sentiment indicator that occasionally provides useful signal amid the noise. Just don’t mistake it for a crystal ball.
After all, even the original Santa requires a certain suspension of disbelief.
Note: This analysis was later quoted in an interview I gave to Market Watch. But that was only after it was published here. Subscribe here to be the first to know when I publish a new analysis
Methodology: Analysis based on daily OHLCV data for SPY, QQQ, IWM, and DIA from September 2003 through December 2025 (5,600+ trading days per index), sourced from Arx (my company’s) unique systems (arxhq.com). Santa Claus Rally defined as the last five trading days of December plus the first two trading days of January, per the Stock Trader’s Almanac convention. Returns calculated as close-to-close across the full seven-day window.
Disclaimer: The information provided in this article, including any references to financial data, market performance, and trading strategies, is for informational purposes only and should not be considered as investment advice or a recommendation to buy or sell any type of securities. The author is not responsible for any investment decisions made based on the information provided in this article. Investors should always conduct their own research and consult with a professional financial advisor before making any investment decisions. Past performance is not indicative of future results, and no representation or warranty, express or implied, is made regarding future performance.
Wow, the part about Yale Hirsch documenting this in '72 really stood out to me. Does historical market folklore like this still influence modern trading algorithms? So insightful!